
Let’s talk about core web vitals, the latest Google update that will hit the internet in May 2021. These will be site ranking factors that WILL impact your Google ranking! So its time to do a clean up of your website and start optimising for core web vitals now!
Here is what you should know about the latest page experience update from Google and how to improve them to boost your rankings.
The Tools that we will use in this blog post are:
- Google Pagespeed Insights Tool
- Google Search Console
What are Core web vitals all about?
The main purposes of Core web vitals are to check the user experience of a web page against Googles criteria. These factors basically help Google assess the quality of a web page from the perspective of a user. Already sounding techy? Don’t stress just yet, we have some great information below for you.
Page experience isn’t the only factor to rank your site though. There are over 200 factors that impact your ability to rank #1
There will be three main factors that you should pay attention to initially, and they are:
- Largest contentful paint (LCP)
- First input delay (FID)
- Cumulative layout shift (CLS)
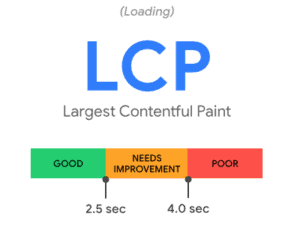 Largest Contentful Paint (LCP) – Measures when the main content had downloaded, visible and useful to the site visitor. Worth 25 % This is often impacted by images and scripts running in the background. One that comes up a lot is the big banner image lots of websites have when the website first loads and videos. When the largest element appears on the screen, users (and so, search engines) assume that the page is ready to navigate. The LCP score for your web pages indicates how the pages perform in the real world. Google uses data from Chrome browsers to analyse loading times. The LCP is measured in seconds and ranked as good, needs improvement, or poor.
How to Improve LCP
If any of your URLs appear in the “needs improvement” or “poor” categories, find ways to speed up the loading times.
Google makes this process easy, as potential problems that impact loading times are found under the “Diagnostics” section of the pagespeed insights report.
Some fixes for LCP:
- Reduce image file size – Shrinking the file size of the largest element should positively impact the LCP time. Images are often the largest files. Resize images to fit the page instead of forcing the browser to downsize images.
The resolution should also be set to 72 dots per inch (dpi), which is the highest resolution that most browsers support. - Eliminate unnecessary scripts – Remove any unnecessary scripts from the page. This may include scripts for various widgets or plugins that the page does not necessarily need, such as a social media feed or dynamic ads that appear in the top third of the page. Avoid using CSS and JavaScript in the HTML of the web page. Placing large sections of CSS and JavaScript code in separate files can reduce load times for repeat visits, as browsers cache the files.
- Minification – Using separate CSS and JavaScript files also makes it easier to minify the code using an online minification tool. Minification is the process of shortening the names of variables and eliminating unnecessary blank space to reduce file sizes.
- Defer Javascript – Placing links to JavaScript files at the end of the body of the HTML or using the “async” attribute can also reduce the initial load time by letting the LCP element load first.
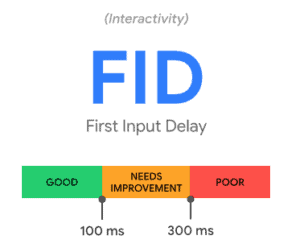 First Input Delay – How long a user has to wait for the site to react when interacting with a web page element like a link, a button or a menu. Worth 15% Do you have to wait for things to load before you can click a menu or open a toggle? This is more important for pages that require users to do something as soon as they land on it. For example, a login page or sign up page etc
Google analyses the response time for interacting with the following elements: Text fields, Checkboxes, radio buttons, select dropdowns and links
How to Improve FID
Many of the steps used for improving the LCP may also improve the FID of a web page. Long delays often occur when the browser is busy making server requests and rendering content.
Some fixes for FID:
- Reduce the impact of third-party code – If you must keep a third-party script, load the script using the “async” attribute to prevent blocking document parsing, which can reduce the load time for other elements on the page.
- Minimising main thread work – Minimising main thread work reduces FID by allowing the browser to render content more efficiently. The main thread processes the HTML, builds the DOM objects, parses CSS, and executes scripts. It is also responsible for processing user events. Along with the previous page speed improvements, simplifying the layout of your page may reduce main thread work
- Reduce request counts – Reducing request counts also improves FID. Loading a page may require the browser to make hundreds of requests. Browsers make requests to receive documents, media, scripts, images, stylesheets, and other files needed to render the web page.
Minimise requests by combining resources whenever possible. For example, you may not need three different CSS files for a single page. You can also utilise browser caching to limit requests.
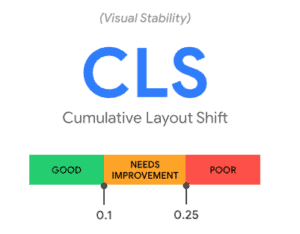 Cumulative Layout Shift – Measures how long until page elements (like buttons, images and text) stop shifting around and are stable enough to be successfully interacted with. Worth 25% An easy win here is to make sure that your images all have their dimensions included by your web developer. this will ensure that images have a place and don’t move around your screen.
How to Improve CLS
Layout shifts typically occur when the browser loads elements above existing content. Common causes include images or videos with unknown dimensions or fonts that render in a smaller or larger size. To avoid layout shifts and improve CLS, always include the size attributes when adding images or video to the page. If the size is unknown, content that appears after the element may shift as the image or video loads.
Some fixes for CLS:
- CSS aspect ratio boxes – An alternative option is to reserve space using CSS aspect ratio boxes. A ratio box ensures that the browser reserves space while the larger element loads.
- Remove ads – Ads are also a common source of layout shifts. Removing ads may improve CLS. If you must include ads on the page, use CSS to reserve space or avoid placing them above the main content.
- iframes and embedded widgets – include a CSS placeholder to reserve space.
- Dynamic content – Dynamic content, such as sign-up forms, pop-ups, sidebars, and notices may create layout shifts when placed above existing content. Dynamic content takes longer to load, allowing text and other content to load first. Either use a placeholder or avoid placing dynamic content above existing content.
Why are Core Web Vitals important for SEO?
Imagine a page that takes too long to load and keeps users from quickly navigating to the information that they want. Or a page that is not visually stable that jumps all over the place when loading and provides a bad experience.
Google wants to ensure that its search results provide the best answer to users and that includes user experience. It is no longer just about keywords and backlinks (which there has been much less of a focus on in recent months), Google is placing more importance on the quality of a page based on the experience it provides users.
User experience is becoming increasingly important for Google and how it ranks pages. In other words, what hurts user experience will hurt SEO.
So what makes up the other 35% of Web Vitals you ask?
While the Core Web Vitals are the critical metrics for understanding and delivering a great user experience, there are other metrics that make up that remaining percentage. These are things like:
Time to First Byte (TTFB) –
This is the time that it takes for a users browser to receive the first byte of page content. This metric fails when the browser waits more than 600ms for the server to respond. When users navigate to a URL in their web browser, the browser makes a network request to fetch that content. Your server receives the request and returns your website page. To work out how to improve this, you first need to work out what is causing it. What tasks is the server needing to complete and how long does each one take.
How to improve this in WordPress? Themes, plugins, and server specifications all contribute to server response time. Consider finding a more optimised theme, carefully selecting an optimisation plugin, and/or upgrading your server, again mostly a web dev’s job.
Time to Interactive (TTI) –
The TTI metric measures the time from when the page starts loading to when its main sub-resources have loaded and it is capable of reliably responding to user input quickly. The best way to measure this and see how your website is performing is to run a Lighthouse performance test on your site (link below). If you want to get super geeky there is lots of information on this page about some of the things you can improve like minifying javascript, reducing third party code like heatmapping or google analytics (but don’t remove this one!), minimising main thread work, keeping chains low (how many pages need to be called to get information to the user),
Reduce server response times (TTFB)-
This audit fails when the browser waits more than 600 ms for the server to respond to the main document request. Users dislike when pages take a long time to load. Slow server response times are one possible cause for long page loads. When users navigate to a URL in their web browser, the browser makes a network request to fetch that content. Your server receives the request and returns the page content.
How to improve this? You first need to identify the tasks that your server needs to complete, measure how long they are taking and then work out ways to speed them up. Again, get your web dev onto this as their next job!
The biggest issues I have with the changes are that the smaller guys will have to put the effort in, as these changes can really only be performed by someone with CMS coding experience. Which means I would get onto your developer now to try and get your website performing as best as possible for the changes coming.
To find out how your website is performing, you can access all three metrics through the following:
Chrome user Experience Report
Page Speed Insights
Search Console
Google Search Console: Core Web Vitals report
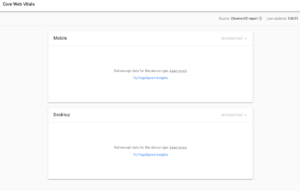
You can view the latest report on the core web vitals for your pages by visiting Google Search Console.
The Core Web Vitals report is found under the “Enhancements” section. You can check your website’s core web vitals for both mobile and desktop.
Google groups URLs together based on their performance:
- Poor
- Needs Improvement
- Good
If you are in GSC and you see the following image, don’t stress. It just means that there isn’t enough data run on your site yet to give you any feedback.
Update to this blog post: The Search Engine Journal did a great comparison of different platforms and the potential effects that Core Web Vitals will have on the top contenders. It was a really interesting read. Obviously, I’m pro WordPress, and I was surprised that WP only made it in the top spot a few times, and some of the other platforms had a good run. The moral of the article, among other things, is Wix is still the worst performer (no surprise over here) If you would like to read the article head over to the blog – Core Web Vitals Challenge: WordPress vs Everyone
